The New System of Reports in iSpring LMS

We have been working on the new reporting system in iSpring LMS for quite some time, and the day has come! Today, we’re excited to present you with the brand-new reports.
Before, iSpring LMS already had a helpful set of 21 reports, and we didn’t only add some bells and whistles and refresh the interface here and there, we developed the completely new reporting system from scratch. We collaborated with many of our clients, the real-life corporate training practitioners, to build reporting tools which meet business needs and add a new level of convenience for LMS admins.
So, how is the new system different?
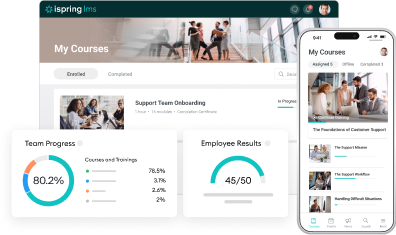
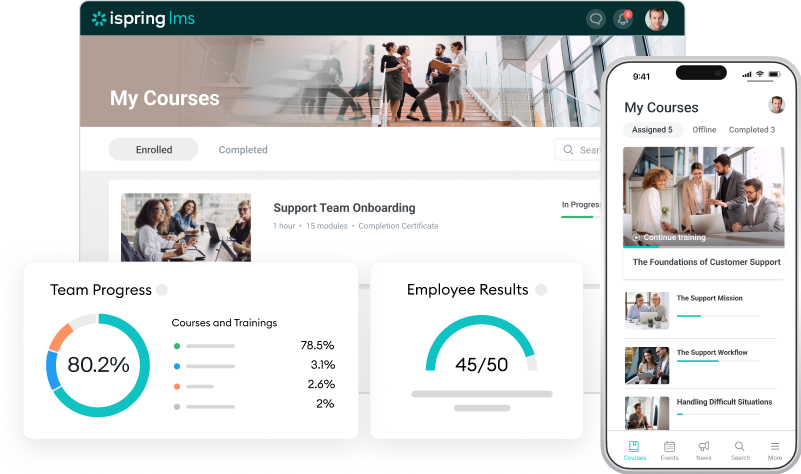
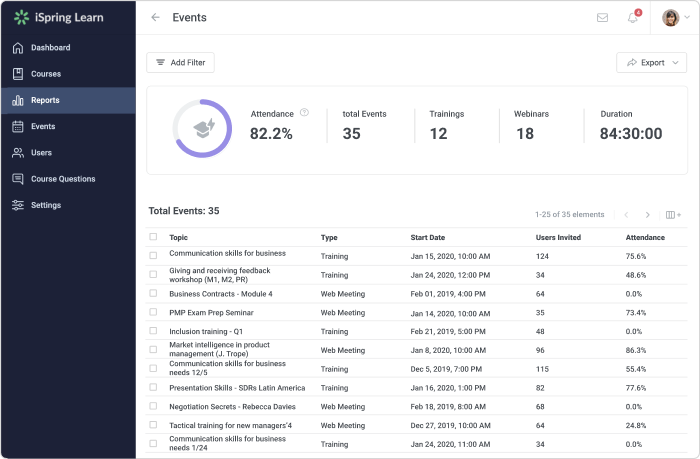
A visual dashboard allows you to get a quick update on what’s happening from just a single glance. For example, by clicking on the Events report, you get an instant overview of webinars and offline training sessions and their attendance.
Statistics are easier to absorb with neat visualizations.
The reports are linked with each other. No report is an island: for fast and convenient work, the reports are now interrelated and unified in a system. Here’s a quick example of why you need this. Let’s say, you are viewing a department progress report and get interested in the results of some particular user. In the system with isolated reports, you’d have to run a separate report with learners’ progress from a separate interface; in iSpring LMS, you just click on this user to see the list of all courses which have been assigned to them and overall progress.
Quick filters help you to get targeted reports. You can easily create user segments, receive data from definite departments, or check out the statuses of courses assigned in the current month. Filters are quite useful when you want, for example, to get statistics on all accountants in your organization, unrelated to a branch and office.
Flexible customization. Sometimes, reports are too heavily packed with data; the easy customization options allow you to remove unnecessary fields and receive a focused and succinct report which reflects only those metrics that you need. Then, you can instantly export these data as an XLSX or CSV file to use in your business documents and reports.
So, let’s take a look at what kind of data you can get with iSpring LMS.
Learner Progress
The report gives you a full progress overview of all the learners and departments in your company: how many courses they’ve completed, how many are overdue, and also how each user performs. Thanks to the multiple filters, you can quickly get statistics on a specific department, group, job position, or whatever else you consider useful.
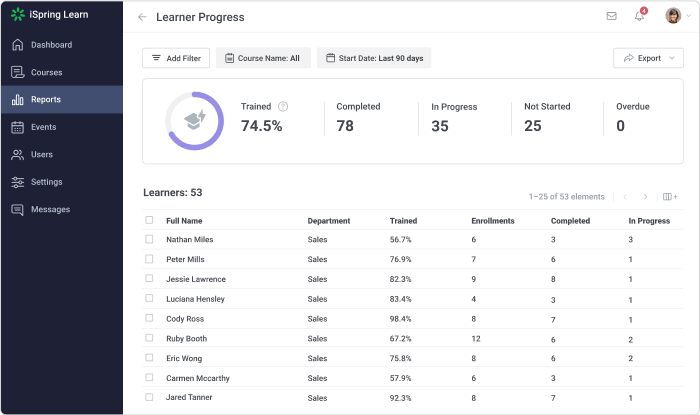
Tip: Right from the report, admins and trainers can contact learners who need their attention. It only takes clicking on a user name!
If you select a user (or just apply a new filter and type a user’s name) and click on Learner Result, you’ll see a whole new report.
Learner Results
This report gives you an accurate picture of a particular user’s achievements. It shows all courses assigned to the user, their statuses, and other relevant info, like the number of attempts, time spent, and more.
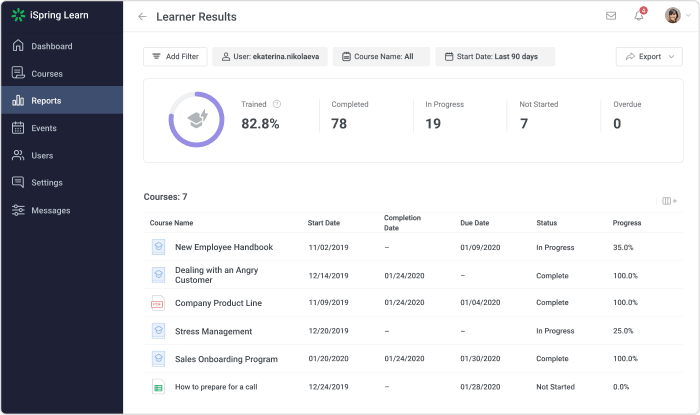
If you want to focus on one of the courses, select the one you want to check out and click Completion Details to generate yet another helpful report.
Course Details
The Course Details report is a powerful instrument which helps you to analyze how a learner is progressing with the specific course. It shows:
- the overall info on course completion, e.g., how many modules have been completed and how much time has been spent on them
- the granular details on each content item within a course: their statuses, awarded scores, completion dates, and more.

A course usually consists of multiple modules, and for some of them, you may want to learn even more specific details. E.g., for a test, you may need to find out not only an overall score but check out the replies to each question. Here you go! Right from the Course Details report, you can get access to module-specific stats.
If you select a graded test (quiz), a survey, a dialog simulation, or a freeform assignment module in this report, you can view their completion details.
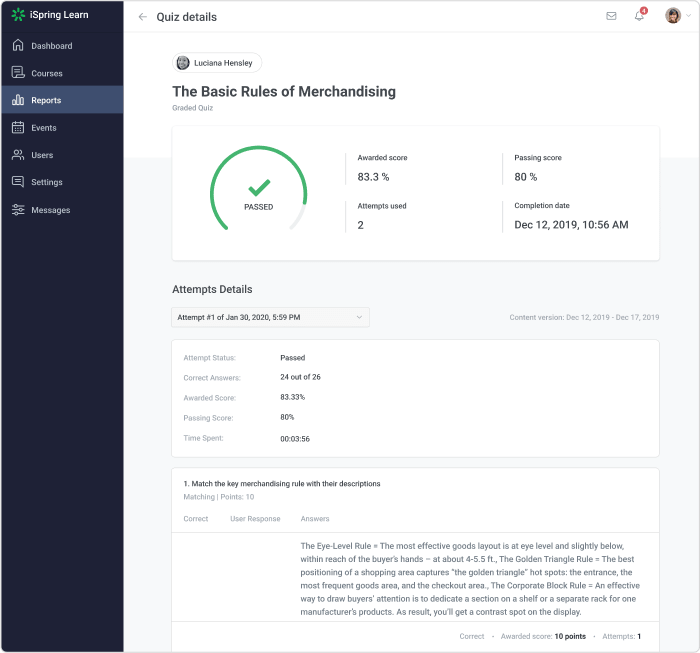
Quiz Details & Dialog Simulation Details
These two reports are quite similar to each other, so we’ll explain them in a single go. They give you detailed info on how a learner is progressing with assessments and surveys. For any test or dialog simulation a user has taken, you can see:
- scores and number of attempts
- a per-answer breakdown
- the time spent on the assessment
- the completion date
Completion Details for Assignments
Just in case you are new to iSpring LMS, a freeform assignment is a task your learners complete outside of the LMS, e.g., prepare a detailed answer to a question, create a case study or a presentation, or record a video. Then, learners upload the files to iSpring LMS to be checked by an instructor.
If you generate the Completion Details report for an assignment, it’ll show all the relevant info: the scores, completion dates, attempts, and instructor’s comments and replies.
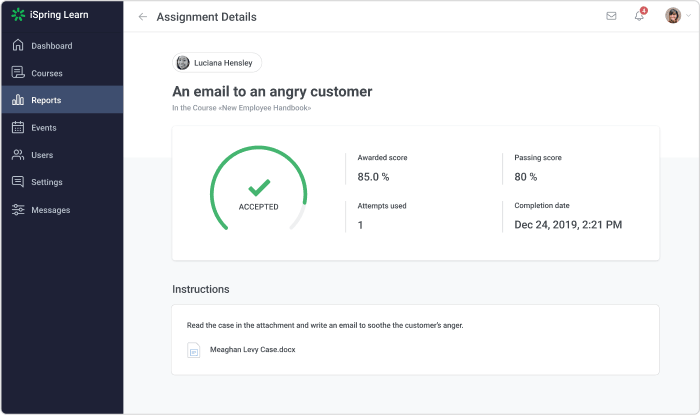
Tip: If the assignment hasn’t been checked, you can view and grade it right from the report.
Well, we’re done with learner-related reports, and are now going to move to reports which deal with multiple users.
Group Progress
This report features both a quick access dashboard and detailed data on group performance. It shows all user groups in your account, their course completion statuses, the total number of assignments, due dates, and other relevant info. It helps you identify groups that have overdue assignments or, vice versa, shows the best results.
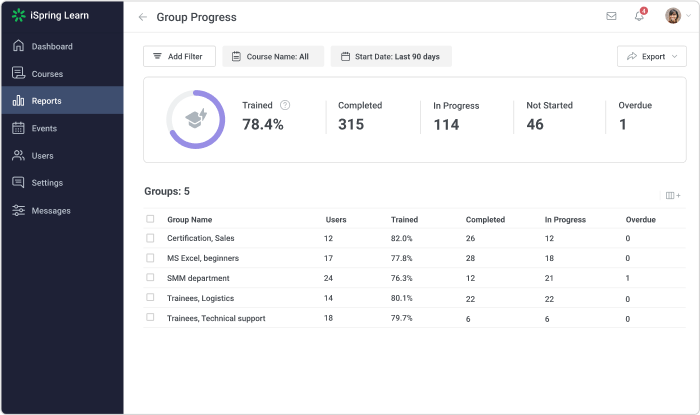
If a group requires extra attention, you can immediately see a per-user breakdown. It’ll take you just a couple of clicks: select a group and click on the Learner Progress button.
Department Progress
The report lets you easily monitor how teams in your organization are performing: how many courses have been assigned, started, and completed and what the overall department progress is.
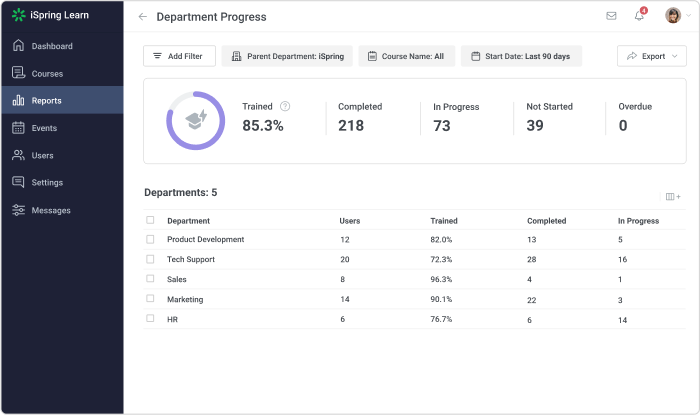
You can easily go deeper and view sub-departments’ data just by clicking a parent department.
Learning Track Progress
With this report, you are always up to date on how your learners are performing with their long-term programs. It gives you overall info on all learning tracks you have, and you can see:
- which learning tracks have been started and completed and which are overdue
- what the learner progress on each track is
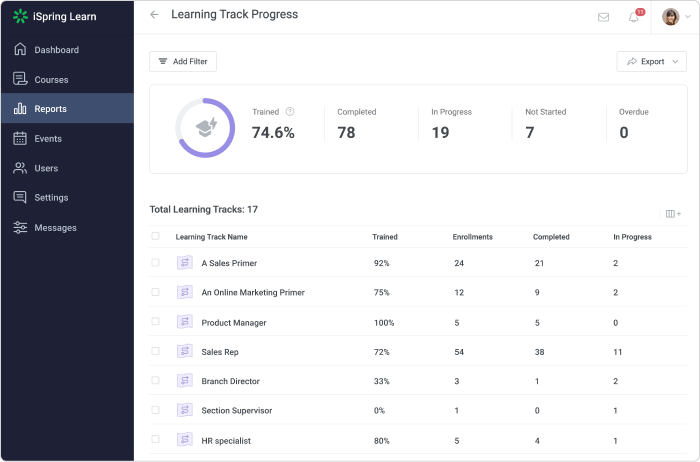
From this report, you can dive deeper and get more info on each learning track.
Just select a learning track you are interested in, and click on the Learner Progress button.
You’ll see the list of users who have been assigned to this track with their due dates and progress, including granular details like how many courses they have started and completed and more.
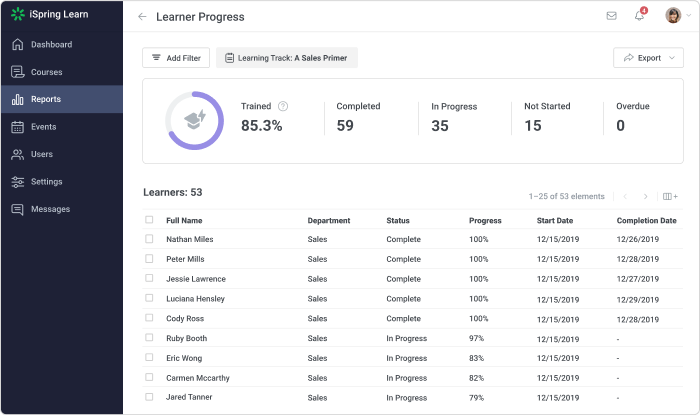
If you select a user, extra reporting options will appear: click on Completion Details, and the LMS will show this user’s progress on each course within a learning track. If necessary, you can move even further and check out each training module in a course.
Course Progress
The Course Progress report shows overall info on all courses in your account: how many learners have been assigned to courses, how many users have started or completed a certain course, and more. You can use filters to zoom in on a specific department or quickly check the progress of courses assigned in the current month.
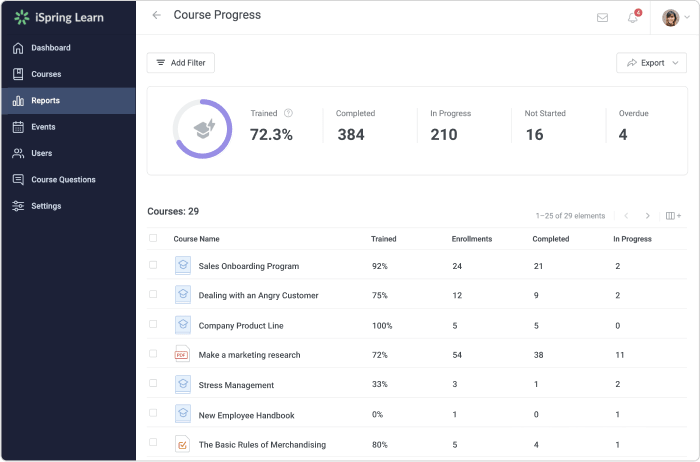
Plus, by just selecting a course (or courses), you can jump to Learner, Department, and Group Progress reports in the context of this course.
Events Details
With iSpring LMS, you can also plan and track events that happen outside of the LMS, e.g., workshops, offline training sessions. The Event Details report combines info on the offline classes and webinars you deliver in iSpring LMS.

It covers all finished and planned events: their type (offline training or a web meeting), instructor’s name, location, duration, the number of participants, and much more. To make reports more focused, use filters, e.g., if you need to estimate an instructor’s workload, you can run a report only for this trainer.
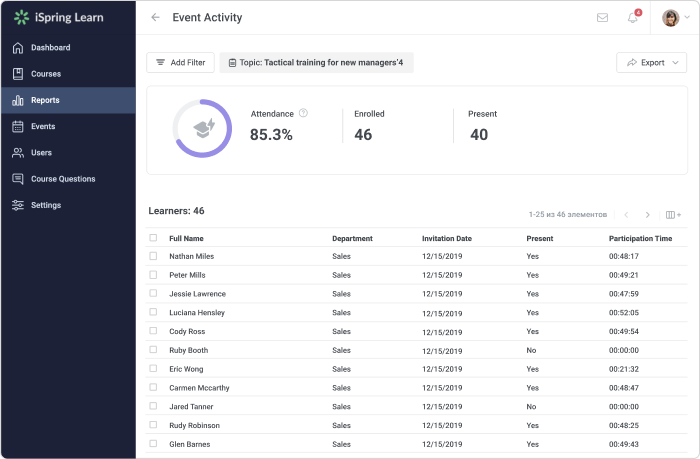
Event Activity
Clicking on a web meeting or a training session gives you access to the detailed metrics on each specific event: the list of users who register for it, the time each participant spent there, and other user-related info.
The LMS metrics are an important part of any eLearning project, as they allow you to relate users’ performance and business metrics and find out how effective your training is. We hope that this article will help you automate data monitoring and gathering and will add to your project success.
If you still have questions about reports, ask us in the comments below. We’d love to answer them!
for your mission-critical project