A Supervisor Dashboard: Track Learner Progress with iSpring LMS

Tracking learner progress with iSpring LMS has become even simpler. Now you can see real-time statistics on individual and department learning progresses.
A supervisor dashboard allows you to keep tabs on the overall learning progress, which employees know work standards and regulations thoroughly, and which ones need some help.
If an employee ignores online learning – they don’t visit the learning portal and don’t complete courses, for example – you’ll be the first to know. And this will allow you to take quick action to remedy the situation.
Let’s see how it works.

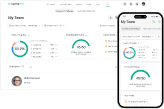
This is what the dashboard in iSpring LMS looks like. Here, learner progress is like an open book.
Get team progress under control

The dashboard shows you how many employees have completed a training program, and how many haven’t started it yet. You won’t have to gather this detailed information from different reports anymore – iSpring LMS will collect all the most essential data in one place.
The User Issues block in the main panel tells you which employees forgot deadlines or failed a test. As a supervisor, you can be informed in time to remedy this. For example, you can remind your team about the quiz they’ve been assigned, or find out why they haven’t visited the learning portal for a long time.
Collect learning statistics on each team member

The My Team panel offers learning statistics on all employees: the date of their last visit and the amount of completed, failed, overdue, and expired courses. With it, you can see who makes progress and studies extra materials, and recommend them in the talent pool.
A supervisor can see their team’s overall progress in percentages. This helps to identify the employees who fit a company’s standards and can perform their job duties. This percentage can become extra KPI metrics for line managers. If they want to track their success, they just need to access iSpring LMS.
Find out who needs help

The dashboard allows you to filter employees, allowing you to see who is slow at eLearning and vice versa – who completes all the tasks on time and volunteers to take extra courses. You can praise employees who show initiative at general meetings and set them as an example to their colleagues.
These statistics will also be useful if your company plans to implement innovations and wants employees to prepare for them. For example, if you launch a new product, a sales manager should know how to present it to a customer so that they’ll want to purchase it.
Track intern progress

The manager dashboard can help you track the progress of new employees. In User Profile, you can see which topics an employee has already completed and which ones have yet to be started. This will identify the status of the internship and let you know what tasks an intern can already take on.
You can see all the courses that an employee was assigned and their deadlines on the dashboard. Status shows who completes courses on schedule, and who needs more time.
How to enable a supervisor dashboard in iSpring LMS
Only a supervisor can see a new dashboard in iSpring LMS. It’s not available to others. Let’s see how to assign a supervisor:
1. Go to the User Management section and click on Departments.

2. Choose the necessary department and click on Edit Department.

3. Choose a supervisor. You can select the supervisor from the parent department, or assign a new one manually.

4. Save changes. Once you do this, a supervisor will see a new My Team tab with a dashboard on their panel.

A dashboard works both in desktop and mobile versions of iSpring LMS.
How to work with a supervisor dashboard in iSpring LMS
We’ve made a short video tutorial to facilitate implementation of this tool for you. You can share it with your colleagues so they could understand how a works and how it can help them.
A manager dashboard is already available for all iSpring LMS users. If you have an active subscription, the update is free of charge.
If you don’t have a subscription yet, get a fully functional iSpring LMS 30-day free trial to test this new feature and many other capabilities. Good luck!
FAQ: Supervisor Dashboard
What is a dashboard report?
A dashboard report is a visual representation of essential data and key performance indicators (KPIs) consolidated in a single, easily accessible interface. In the context of a supervisor dashboard, it provides a comprehensive overview of various metrics related to the performance and activities of agents within a contact center. This includes tracking agent’s activity, interactions handled, interaction types, talk time, idle time, and more.
Why are dashboards important?
Dashboards are crucial for supervisors as they offer a real-time snapshot of critical metrics such as agent’s activity, interactions handled, interaction types, talk time and more. They enable supervisors to make informed decisions swiftly, monitor the customer experience, and optimize contact center operations for enhanced efficiency. By leveraging the supervisor dashboard, managers can gain valuable insights into the overall performance of the contact center, ensuring a seamless customer experience.
What is an online dashboard?
An online dashboard is a digital, web-based platform that allows users to access and interact with real-time data and analytics. In the context of a supervisor dashboard, it facilitates instant access to metrics related to agent performance and contact center activities. The online dashboard is a user-friendly tool positioned in the top right corner of the supervisor’s interface, offering a dynamic view of metrics such as the total number of calls, interaction types, and real-time data. Supervisors can efficiently use the online dashboard to monitor and manage agent’s activity, talk time and overall contact center performance. This immediate access to real-time information empowers supervisors to make timely decisions, enhancing the overall efficiency and effectiveness of the contact center.
Create online courses and assessments in record time.


The 6 Best Skills Assessment Tools: Separating the Great from the Good