Understanding LMS Reports: 13 Things to Look at in Your eLearning Statistics

If an LMS is going to help you run online training, then LMS reporting shows whether you are succeeding in your training efforts. Thanks to LMS reports, you gain key metrics to measure your eLearning and evaluate learners. In this article, we’ll guide you through the most important types of LMS reports and show you how to translate vague statistics into a language of benefits for learning and business.
What is LMS Reporting?
LMS reporting is a system of data collection and analysis in your learning management system. Basically, LMS reports help you monitor what’s going on with the training process, what it means, and what you can do to improve results. In other words, they tell you whether your efforts are actually translating into results.
Here are the main opportunities that reports can give you:
- Progress tracking. If you are responsible for training in your organization, you need to know how employees are progressing through courses.
- Understanding training outputs. What have employees learned? How well did they retain the knowledge? If a learner takes a course and passes the test, we conclude that they have gained the necessary knowledge and are ready to practice it and make a change. The ultimate goal of learning is a change of behavior in work-related tasks, which results in desirable changes for the business.
- Content evaluation. Do we make good content? How do learners interact with it? How much time do they spend on it and what parts of a course are easy or difficult for them? Reports let us know about the shortcomings of the content and what we should improve.
- HR and management reporting. If you need to inform stakeholders, investors, board of directors, or the head of HR about employee development, you certainly should present measurable training results to them. These data-based insights on how corporate training is going will be more than welcome.
- Internal issue identification. In terms of incident management, if an employee makes a mistake that impacts your company, you may need to know their performance in training precisely. Maybe they didn’t take courses on compliance? Or failed a particular test on customer service? Another example is when you need to make personnel changes. Then it’s important to understand a person’s commitment to learning. Did they study regularly and accomplish courses? Or did they even try to learn?
It takes no effort to address these tasks with LMS reports because they are typically out-of-the-box solutions. Also, they can support data layout and make your statistics neatly organized and structured on templates. In various LMSs, reporting is pretty similar, but we’ll take iSpring Learn LMS as an example in order to explain it.
For your convenience, we’ve organized these LMS reporting capabilities into four major categories. They are four types of metrics that you can use for specific tasks. Let’s dive in.
Metrics to Help You Boost Learning Effectiveness
This is an absolute must for HR and management reporting. You’re unlikely to convince senior executives that a learning project is effective if you don’t have any concrete numbers at hand. Reports will provide you with these numbers. Logging and tracking learner activity plays a key role in eLearning, even if training is not obligatory in your company.
Also read: The 11 Best HR Tools for Streamlining Your Workflow in 2023
1. Learner Progress – to get a full picture of training in the company
This is a full progress overview of all the learners and departments in your company: how many courses have been completed, how many are overdue, and how each user performs. Learner Progress is a cornerstone of all report processes. Multiple filters allow you to go further and get statistics on a specific department, group, job position, and so on.
Why track: You’ll get an overview of training in your organization. If user engagement is low, you will notice it right away and can take action.

If the course started a long time ago but users are still stalling at the start, this should be a red flag for you.
Engagement is one of the key metrics in eLearning and your highest priority. It’s important to determine the reason why it is low. It might be one of the following:
- Employees are unaware the training exists. This may sound strange, but it’s actually fairly common. Spreading awareness with an internal PR campaign might help.
- The content is boring, bulky, unengaging, or irrelevant to their jobs. The employees don’t like it and lack the motivation to take part in learning. Or maybe they don’t see its real-world benefits. You can try to break the material into shorter modules, use interactions, pictures, or videos to make it more interesting.

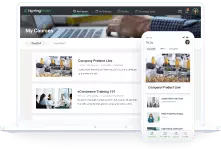
iSpring Learn LMS
Automate corporate training and improve employee performance.
2. Learner Results – to see how a specific user performs
When looking at the overall picture, you might find that someone needs extra motivation to go through courses. Learner Progress will allow you to make sense of this. Learner Results gives you an accurate picture of a particular user’s performance. You can view all courses assigned to that user, their statuses, the number of attempts, time spent, and more.
Why track: Knowing a person’s individual progress, you can understand who needs more attention, identify high-potential workers, and make judicious personnel decisions.


3. Course Details – to check how a learner advances through a specific course
Want to look deeper? No problem. This report is an effective tool that helps you analyze how a learner is progressing with a specific course. It provides:
- The overall info on course completion: number of modules completed, time spent on them, etc.
- Highly detailed data on each content item within a course: their status, scores, completion date, etc.
For example, you can have a sophisticated course with several modules followed by pretests and the final exam. This report will help track the dynamics of results an employee shows and exhibit how they progress each time. By the way, pretesting is always worth doing whenever possible. It allows you to assess employees’ entry level objectively and perceive their knowledge gaps. Also, the “before and after” comparisons look great and perfectly demonstrate the results of training to all stakeholders.
Why track: You can see how it is going for your learners, how well they progress through courses, how they manage within a particular course. Learners’ achievements give you an outline of the effectiveness of a learning project.

One of the key metrics in this report is scoring. The passing score will be the one you set when creating a course. The awarded score is the one that learners actually get while taking a quiz.
A situation where many users have low scores for a test should be a matter of concern. One of the reasons may be that the test is too complicated; it then makes sense to rework it. On the other hand, if users get the maximum score at the pre-test stage, you should add some challenges to make the course more challenging.
So we’ve collected expert tips on making high-quality tests and have drawn up an action plan for cases when users’ scores are abnormally high or low.

4. Assignment results – to find out how students do on their assignments
You may sometimes need to have your learners complete a task outside of the LMS, such as writing an essay, uploading a presentation, or recording a video. This is called a free-form assignment, and learners upload it to the system as a file. For example, you train sales representatives and teach them merchandising. Then you can give them the assignment to arrange hair dryers on the shelves, take a picture of the final result and upload it. There is a specific report that shows all the completed tasks and the grades for them.
Why track: You will know how students did on the tasks that were performed outside of the LMS. If the assignment still has no mark, you can view and grade it right from the report.

5. Progress Achievements – to see how users progress through quizzes
This report demonstrates learners’ progress in online quizzes and works perfectly for exams and assessments.
Why track: You can see who has been certified during the regular appraisal period and assign retraining if needed.

Metrics to Help You Make Better Courses
When you’ve been working on a course for a long time, you face the risk of making it too detailed and miss the point of its quality and accessibility. Fortunately for eLearning developers, there is an entire set of LMS reports that will help to see the quality of the learning content.
6. Modules Report – to find out how your employees take modules
If many learners keep failing on certain courses, something may be wrong with a particular section, such as one of the course’s modules. You can easily check if employees of a certain department have any overdue modules or how far learners have advanced through the content items.
Why track: With the Modules report, you can identify why learners fail a certain part of a course time after time. It allows you to see the problem clearly and then ask people what is wrong with the content. Maybe it’s not covered thoroughly enough, in which case it’s better to revise it.

7. Answer Breakdown – to see the number of attempts to pass and choices
This report includes information on the average score and users’ response distribution for each question.
Why track: You’ll be able to analyze the accuracy of the assessment and understand what you are dealing with: widespread mistakes from students or a lack of clarity in the course.

For instance, you might discover that a high number of users can’t get past a certain question or group of questions. The first thing you have to do, in this case, is to make sure the task is clear, its definition doesn’t contain any ambiguities, and the answer to the question is actually present in the course.
If everything is alright with the test, double-check the content — perhaps the topic was poorly covered in the course. The easier and quicker way to fix that is to insert links to additional explanations and materials on the topic or assign some extra homework. Otherwise, if you still have sufficient resources, it might be worth it to thoroughly rework the course.

Even if there are some common user mistakes, it is not always necessary that you change something.
Note: Not all LMSs are capable of tracking learner progress in quizzes and providing answer breakdowns. The reason is the SCORM standard that restricts transferring of such detailed data. In this case, iSpring has a competitive advantage: our own authoring tool. Courses made with iSpring Suite Max can be uploaded to iSpring Learn directly. That’s why it is able to collect detailed data about every attempt of learners to pass a test. Other LMSs may leave you completely in the dark about the real problems with your training.
Metrics to Help You Find Learning Sprinters and Stayers
Corporate training isn’t conducted for the training’s sake. It is driven by various business needs, and you need to have employees achieve the appropriate qualification level to meet them. The metrics below will indicate which employees are the most loyal to your company’s values and who perform better.
8. Leaderboards – to identify the top learners
This is a super-useful metric when you’re interested not only in formal training but would also like to work with a talent pipeline.
Why track: You’ll identify who is committed to mastering skills and professional growth in your team.

Rewarding the most active learners can be a good corporate tradition.
Many employees often hesitate to say that they’re ready for greater responsibility, new roles, and more complicated tasks. If they keep making it to the top of overall ratings, the report will demonstrate they are really trying their best, and you can rely on them. At the same time, information that someone is studying courses beyond those related to his or her normal job requirements can be useful when deciding on a possible promotion.
9. Group progress and Department progress – to check group progress on one or multiple courses
Sometimes, when you take a broad look at learner progress or specific course completion in your organization, the rate of trained users leaves much to be desired. There may be a certain department or a group that is lagging behind. This report can provide you with both quick access to statistics and detailed data on group/department progress.
The Group progress report demonstrates how project groups and particular teams are performing. You can organize personnel in whatever groups you need: task forces, groups of interns or senior executives, etc. The report will show all user groups in your account, their course completion statuses, the total number of assignments, due dates, and other relevant info. It helps you identify groups that show the best results or those with overdue assignments.

Department progress shows you how your company’s branches and divisions are performing: number of courses assigned, started, and completed, and what the overall department progress is.
Why track: If some department shows poor performance in training, you can look for the causes and talk to the head of the department. Then, knowing a situation with learning in a specific group, you can detect bottlenecks and risks for your business.

10. Session Details and Participant Details – how many and who registered, attended or missed the course events
These reports are valid for training events no matter how you conduct them: online, offline, or elsewhere. iSpring Learn incorporates them all and provides you with relevant statistics.
Why track: You’ll be able to monitor how learners participate in webinars and in-class training and implement blended learning more effectively.

The key factor assessed by these reports is attendance that shows who participates in activities or misses them. Attendance can bring you much food for thought. If a lot of learners missed an event, it’s time to find out why.
However, the reason why you need to track attendance is far from merely punishing truants. This metric will show you other equally exciting facts. For example, you will find out which courses are the most interesting and valuable for learners.
Plus, attendance is directly related to the concept of “lifelong learning.” If an employee is studying hard, it means they have self-development in view. This helps them manage their daily work more effectively, which surely benefits the employer.
Still, you might find employees who refuse to study. Perhaps they’re not interested in what they’re doing, or they consider their current professional level sufficient. In such cases, it’s necessary to understand the true reasons: talk to the person, see what bothers them, understand what stops them from learning.
Metrics to Make Your Work Easier
Some metrics simply allow LMS administrators to pull out the data they need quickly and deal with routine tasks with less effort.
11. Learning track progress – to check the statuses of learning tracks
If you’ve combined several courses into a learning track, you don’t have to track the data for each course manually. With this report, you’ll see statistics for the entire program: which learning tracks have been started, completed, or overdue, and the learner’s progress on each track.
Why track: To stay up to date on how your learners are performing with their long-term programs.

12. Learning Track Enrollment History – to see the history of enrollments
This report will show how the learning track has been taken by all users over time, and how each learner progressed through the learning track each time it was taken
Why track: You can monitor what mistakes were made repeatedly and work on them with the learner.

13. Active Users Report – to see who uses the LMS and how they use it
The report will help you understand who logged in during a specific period and what device they used: computer or smartphone. For example, you launch mobile learning for employees and want them to study in the iSpring Learn mobile application. This report will show you how often they actually use it. As a result, you can get an idea if they like mobile learning or not.
Why track: The report will track and show you who still doesn’t use the LMS or its mobile version, so you can help them, if needed.

How Can I Use Reports in iSpring Learn?
In iSpring Learn, all reports are interconnected, so you don’t get lost in them. It’s like a funnel: you can see the general information about your training process and then go further to see the picture in detail. Every time you check the learner, course, or department progress, you can use filters to gain more specific information.
Your first experience with eLearning reporting can be on the LMS dashboard.
The iSpring Learn LMS Dashboard – to see brief statistics on activity and quick reports
The dashboard is your homepage in an LMS, the first page you will see in iSpring Learn and your first trusted helper. Here, you will view summarized statistics on the activity in your account, the number of new materials uploaded, added users and groups, and their logins during that month. You can get the full report on these main attributes.
There are also quick reports available to you:
- Ready for evaluation – a list of homework assignments that your students sent for review
- Newest Content – information about the five newest content items uploaded by publishers and administrators last week.

Navigate Reports in iSpring Learn
To start your work with reports, open the Reports section on the left. Here you can access any type of report that we covered in this article.

All the reports are divided into 3 easy-to-navigate categories: users (people’s progress and achievements), courses (content-related metrics), and training (training event attendance).
Here are the tasks you may face and the ways to get to the needed report:
- Progress tracking. Go to By users and select Learner Progress here to see who completed courses and how they fared. If you conduct appraisals or exams, you can see everyone’s results quickly in Quizzes in the By courses section.
- Content evaluation. Go to By courses and see how learners interact with learning materials in the following reports: Courses, Modules, Answer Breakdown, and Learning Track.
- Performance identification. Proceed to By users and check Group/Department progress or Learner Results in Learner Progress.
- Training event evaluation. Explore the Session/Participant details in the Training section.

Export reports
With iSpring, you can export reports to Excel and other advanced applications to proceed with analytics. If you need some more tools to assess data or can’t get to the root of a certain problem in training, you can get more from these statistics in Excel. There you can also illustrate them with diagrams. If your organization uses advanced corporate analytics tools, you can upload LMS reports to Excel and then transfer them to Power BI or other business analytics programs.
Also read: The Top 9 Learning Management System Features Each LMS Must Have in 2023
Schedule reports
In iSpring Learn, you can schedule and automate reporting. It’s easy to set a calendar for reports so your boss can receive them regularly while you have a coffee break.

Conclusion
LMS reports are a magical tool allowing you to relate users’ performance with business metrics. In this article, we’ve covered 13 major LMS reports that are available in iSpring Learn. If you’re short of time and need an extra quick approach, try the following:
- Check Learner Progress every two weeks
- Go for Progress Achievements to quickly understand who passed or failed on a certain test
- Track Department progress to see what team lags behind and why
- Set up scheduling to have reports sent to a recipient automatically and regularly, so you can get this off your table.
If you still have questions about reports, feel free to ask in the comments below. We’d love to help!
")


